13
Using the Command Line
MOA methods and tasks can be used from the GUI as explained in the previous chapter, or using the CLI. For classification and regression, the task commands used in the GUI can be used in the CLI directly. In this chapter we will show how to run these and other tasks from the command line.
Running tasks is as easy as calling the
moa.DoTask
command from the command line. For example, to run the
LearnModel
task, simply type
In the next sections, we will see specific examples of this use.
13.1 Learning Task for Classification and Regression
The first example will command MOA to train the
HoeffdingTree
classifier and create a model. The
moa.DoTask
class is the main class for running tasks on the command line. It will accept the name of a task followed by any appropriate parameters. The first task we will use is the
LearnModel
task. The
-l
parameter specifies the learner, in this case the
HoeffdingTree
class. The
-s
parameter specifies the data stream to learn from, in this case
generators.WaveformGenerator
, generating a three-class learning problem. The
-m
option specifies the maximum number of examples to train the learner with, in this case 1,000,000 examples. The
-O
option specifies a file to output the resulting model to:
java -cp moa.jar -javaagent:sizeofag.jar moa.DoTask
LearnModel -l trees.HoeffdingTree
-s generators.WaveformGenerator -m 1000000 -O model1.moa
This will create a file named
model1.moa
containing the tree model induced during training.
13.2 Evaluation Tasks for Classification and Regression
The next example will evaluate the model to compute its accuracy on a set of examples generated using a different random seed. The
EvaluateModel
task is given the parameters needed to load the model produced in the previous step, generate a new waveform stream with random seed 2, and test on another 1,000,000 examples:
java -cp moa.jar -javaagent:sizeofag.jar moa.DoTask
"EvaluateModel -m file:model1.moa
-s (generators.WaveformGenerator -i 2) -i 1000000"
Observe the use of nested parameters using parentheses. Quotes have been added around the description of the task, otherwise the operating system might be confused by the parentheses.
After evaluation the following statistics are output:
classified instances = 1,000,000
classifications correct (percent) = 84.474
Kappa Statistic (percent) = 76.711
Note that the two steps above can be rolled into one, avoiding the need to create an external file, as follows:
java -cp moa.jar -javaagent:sizeofag.jar moa.DoTask
"EvaluateModel -m (LearnModel -l trees.HoeffdingTree
-s generators.WaveformGenerator -m 1000000)
-s (generators.WaveformGenerator -i 2) -i 1000000"
MOA will create and use the classifier in memory, without storing it in a file.
13.3 Learning and Evaluation Tasks for Classification and Regression
The
EvaluatePeriodicHeldOutTest
task will train a model while taking snapshots of performance using a holdout test set at periodic intervals. The following command creates a CSV file, trains the
HoeffdingTree
classifier on the
WaveformGenerator
data, keeps the first 100,000 examples for testing, trains on a total of 100,000,000 examples, and tests on the holdout set every 1,000,000 examples:
java -cp moa.jar -javaagent:sizeofag.jar moa.DoTask
"EvaluatePeriodicHeldOutTest -l trees.HoeffdingTree
-s generators.WaveformGenerator
-n 100000 -i 100000000 -f 1000000" > dsresult.csv
For the purposes of comparison, a bagging learner using 10 decision trees can be trained on the same problem:
java -cp moa.jar -javaagent:sizeofag.jar moa.DoTask
"EvaluatePeriodicHeldOutTest -l (OzaBag -l trees.HoeffdingTree
-s 10) -s generators.WaveformGenerator
-n 100000 -i 100000000 -f 1000000" > htresult.csv
Another evaluation method implemented in MOA is the interleaved test-then-train. It produces smoother plots of accuracy over time, as each individual example becomes less and less significant to the overall average. Here is an example of an
EvaluateInterleavedTestThenTrain
task that creates a CSV file, trains the
HoeffdingTree
classifier on
WaveformGenerator
data, trains and tests on a total of 100,000,000 examples, and records accuracy every 1,000,000 examples:
java -cp moa.jar -javaagent:sizeofag.jar moa.DoTask
"EvaluateInterleavedTestThenTrain -l trees.HoeffdingTree
-s generators.WaveformGenerator
-i 100000000 -f 1000000" > htresult.csv
13.4 Comparing Two Classifiers
Suppose we want to compare the learning curves of two classifiers, a decision stump and a Hoeffding Tree. First, we have to execute the
EvaluatePeriodicHeldOutTest
task to train a model while taking snapshots of performance with a holdout test set at periodic intervals. The following commands create CSV files and train the
DecisionStump
and the
HoeffdingTree
classifiers on
WaveformGenerator
data, using 1,000 examples for holdout testing, training on a total of 100,000 examples, and testing every 10,000 examples:
java -cp moa.jar -javaagent:sizeofag.jar moa.DoTask
"EvaluatePeriodicHeldOutTest -l trees.DecisionStump
-s generators.WaveformGenerator
-n 1000 -i 100000 -f 10000" > dsresult.csv
java -cp moa.jar -javaagent:sizeofag.jar moa.DoTask
"EvaluatePeriodicHeldOutTest -l (trees.HoeffdingTree -l MC)
-s generators.WaveformGenerator
-n 1000 -i 100000 -f 10000" > htresult.csv
Assuming that
gnuplot
is installed on the system, the learning curves can be plotted with the following commands:
gnuplot> set datafile separator ","
gnuplot> set ylabel "% correct"
gnuplot> set xlabel "examples processed"
gnuplot> plot [][0:100] \
"dsresult.csv" using 1:9 with linespoints \
title "DecisionStump", \
"htresult.csv" using 1:9 with linespoints \
This results in the graph shown in figure 13.1 .
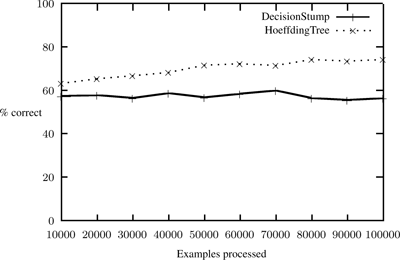
Figure 13.1
Rendering of learning curves of two classifiers using
gnuplot
.
For this problem it is obvious that a full tree can achieve higher accuracy than a single stump. The stump has an almost constant accuracy (around 58%) that does not improve with further training, while that of the full tree increases by 10% on the first 100,000 examples.